Granular Flow in packed bed (Direct Reduced Iron - DRI processes)
Shaft based processes are widely used in many disciplines like chemical, metallurgical, pharmaceutical etc. For example, in metallurgy, they are like Midrex, Blast furnaces, Corex etc.; in chemical like catalytic reformer etc.; and in pharmaceutical like drug coating etc. To maintain the quality of the products in these reactors, it is very important to have a good understanding of the solid flow behaviour along with the gas flow.
These types of flow are quite prevalent in the production of Direct Reduced Iron (DRI) in which almost 95% metallization of iron is achieved. In this process, iron ore pellets are reduced by hot CO gas or CO + H2 gas mixture. Usually, the pellets are fed from the top and gas from the bottom; so, it is a counter-current process. Iron ore reduction takes place in solid state and direct reduced iron pellets come out from the bottom. It is a slow-moving bed reactor.
From the product quality viewpoint and smooth operation of the reactors, it is very important to know the solid flow behaviour along with its residence time. For example, if some particles residence time is much higher than the others then their reduction behaviour and hence the reactor performance would be quite different which will affect the product quality significantly.
Many researchers have tried to understand these processes theoretically, however, the simplifications made by them by making certain assumptions such as potential flow theory and ignoring void fraction variations inside the reactors (which will affect the gas flow profile significantly) have concealed the true behaviour of solid particles in presence of the gas flow.
Here, particles/pellets flow has been modelled using DEM approach and gas flow has been modelled using continuum based CFD approach.
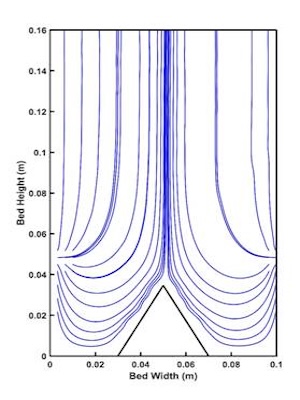
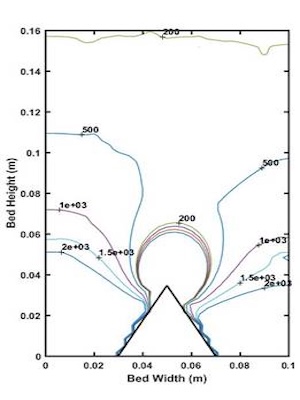
It can be seen from figure 2(a) that the gas streamlines are not symmetrical especially this effect is more prominent near the deadman. This again enforces that the assumptions of symmetry with respect to gas flow and constant void fraction does not represent the system correctly. The same point is conveyed visibly from figure 4 which shows the pressure contours plot.
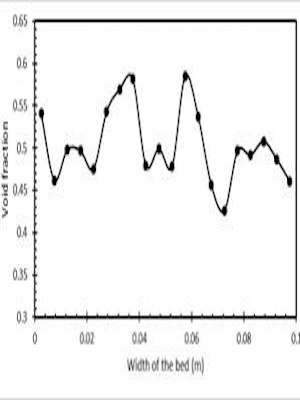
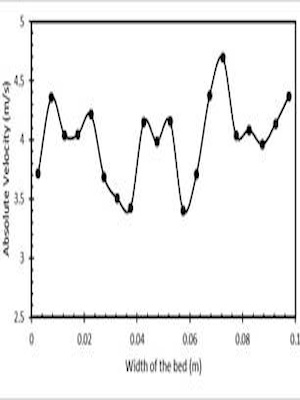
Figures 3(a) shows the typical void fraction distribution across the bed width at the height 0.14 m from the bottom of the shaft. One can see the variation in void fraction across the bed width which is not symmetric in nature, emphasizing the point that it cannot be considered as constant. Corresponding to the void fractions figures 5(a), the gas velocity profiles across the bed is shown in figure 3(b). One can see quite different velocity profile across the bed width reflecting the variation of void fraction and quite far away from the symmetry.
For further details, queries, or publications related to this research, please contact us through our contact information on the website.