|
MANUFACTURE OF BORON CARBIDE |
|
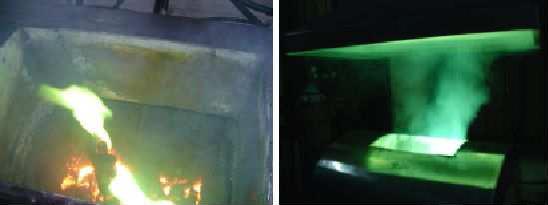
Figure 1. Boron carbide process in operation. |
|
Boron
carbide is produced in a heat resistance furnace using boric oxide and
petroleum coke as the raw materials. In this process, a large current
is passed through the graphite rod located at the center of the
cylindrical furnace, which is surrounded by the coke and boron oxide
mixture. Heat is generated at the surface of the electrode, due to
which boron oxide reacts with the coke to produce boron carbide (Figure
1). The process is inefficient in terms of the production of boron
carbide as only 15% charge gets converted into boron carbide. No
published attempt has been made to optimise the process using
mathematical modelling. Also, experimentally not much work has been
done. Therefore, in this first ever study both mathematical and
physical modelling has been carried out. |
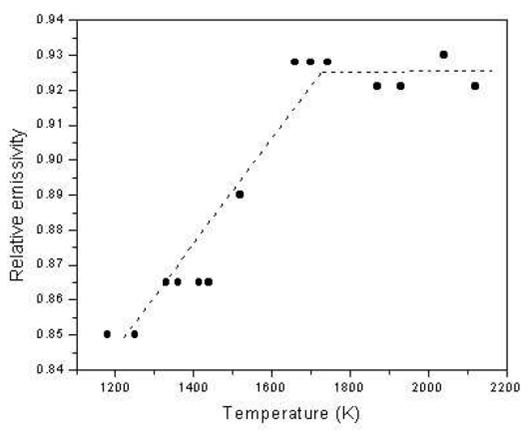
 Figure 2. Plot of temperature vs. relative emissivity for graphite electrode. |
|
In
mathematical modelling, simultaneous heat and mass transfer model has
been developed for the resistance-heating furnace, considering boron
carbide formation as a typical carbothermal reduction. Coupled
transient, partial differential equations have been worked out. These
equations have been solved numerically, using the implicit finite
volume method to obtain the profiles of temperature and volume fraction
reacted (B4C formation) in the furnace. Modelís predictions are
validated against experiments and initially it is found that the match
is poor. This led us to think to find out the uncertainties associated
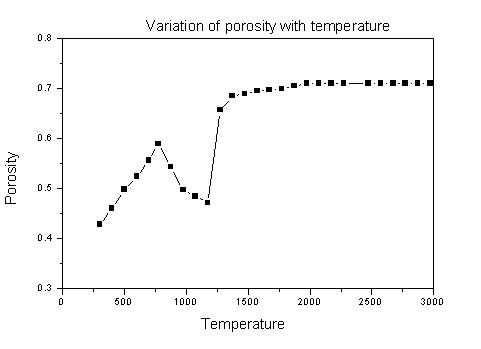
with either the experiments or modeling. It is found that porosity can
affect the simulation results significantly. Therefore, experiments
were performed to measure the porosity of the mixture/product at
various temperatures (Figure 3). Similarly significant inaccuracies are
found in temperature measurements, thermal conductivity of coke, etc.
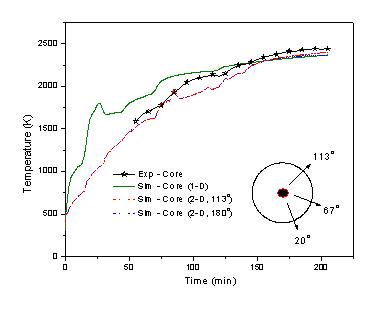
After incorporation of the above corrections a good match is found
between the computed and experimental results (Figure 4). This gives a
fine example that how a mathematical model can be used to improve the
physical model. A Graphical User Interface for the process
has also
been developed.
This process has been optimised experimentally now. A 2-D mathematical model
with GUI is also available for the process.
|
  Figure 3. Plot of temperature vs. porosity Figure 4. Comparison of simulated (1D & 2D) variation for boric acid and graphite mixture. results with experimental core temp. |
|
This
technology and sofware
are ready to transfer to interested industries
(Currently under negotiation with
Indian Armour Systems Pvt. Ltd.).
Interested industries/person, even to setup a plant or transfer of
technology can contact us.
For further details or queries or publication related to this, kindly contact us at the address given on the web-site. |
